YSlow Help
YSlow analyzes web pages and why they're slow based on Yahoo!'s rules for high performance web sites
Introduction
</a> YSlow analyzes web page performance by examining all the components on the page, including components dynamically created by using JavaScript. It measures the page’s performance and offers suggestions for improvement.
YSlow for Firefox is integrated into the Firebug web development tool for Firefox.
YSlow is not integrated into Firebug Lite.
Performance Rules
</a> Yahoo!’s Exceptional Performance team has identified 34 rules that affect web page performance. YSlow’s web page analysis is based on the 23 of these 34 rules that are testable. These testable rules are listed below roughly in order of importance and effectiveness. Studies have shown that web page response time can be improved by 25% to 50% by following these rules.
- Minimize HTTP Requests
- Use a Content Delivery Network
- Avoid empty src or href
- Add an Expires or a Cache-Control Header
- Gzip Components
- Put StyleSheets at the Top
- Put Scripts at the Bottom
- Avoid CSS Expressions
- Make JavaScript and CSS External
- Reduce DNS Lookups
- Minify JavaScript and CSS
- Avoid Redirects
- Remove Duplicate Scripts
- Configure ETags
- Make AJAX Cacheable
- Use GET for AJAX Requests
- Reduce the Number of DOM Elements
- No 404s
- Reduce Cookie Size
- Use Cookie-Free Domains for Components
- Avoid Filters
- Do Not Scale Images in HTML
- Make favicon.ico Small and Cacheable
When analyzing a web page, YSlow deducts points for each infraction of a rule and then applies a grade to each rule. An overall grade and score for the web page is computed by summing up the values of the score for each rule weighted by the rule’s importance. Note that the rules are weighted for an average page. For various reasons, there may be some rules that are less important for your particular page.
From YSlow 2.0 on, users can create their own custom rulesets in addition to the following three predefined rulesets:
- YSlow(V2) - this ruleset contains the 23 rules listed above.
- Classic(V1) - this ruleset contains the first 13 rules listed above.
- Small Site or Blog - this ruleset contains 14 rules that are applicable to small web sites or blogs.
Refer to Customizing Rulesets for more information.
Installing YSlow
</a>
Firefox
YSlow for Firefox needs Firebug to run. Obtain the latest version of Firebug from https://addons.mozilla.org/en-US/firefox/addon/1843. Firebug documentation is available at http://www.getfirebug.com/docs.html.
Once Firebug is installed, download YSlow for Firefox from https://addons.mozilla.org/en-US/firefox/addon/5369. Follow the prompts to install the tool.
Chrome
Mobile/Bookmarklet
Refer to Mobile/Bookmarklet page for more information.
Opera
Safari
Refer to Safari page for more information.
Command Line (HAR)
Refer to Command Line HAR page for more information.
PhantomJS
Refer to PhantomJS page for more information.
NodeJS Server
Refer to NodeJS Server page for more information.
Using YSlow
</a>
Firefox
YSlow for Firefox runs in the Firebug window, so in order to run the tool, Firebug must be enabled.
There are two ways to start YSlow for Firefox:
- Open the Firebug window and click on the YSlow tab.
- Click the YSlow button on the status bar.
The first time you bring up Firefox with YSlow, the following screen will be displayed in the Firebug portion of the browser window:
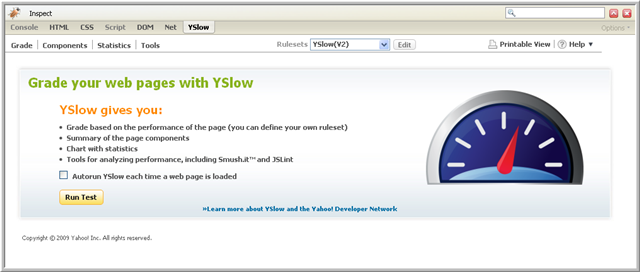
Click Run Test to run YSlow. You may also click on the Grade, Components, or Statistics tabs to start the web page analysis.
You can click on the box next to Autorun YSlow each time a web page is loaded to set up YSlow to run each time the browser loads a web page. You can enable or disable the Autorun option by right clicking anywhere in the YSlow status bar and selecting or deselecting Autorun.
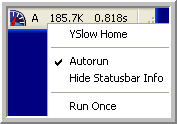
If you left click on the YSlow icon on the left side of the status bar or the response time value on the right side, the page display will toggle between displaying the entire page and displaying the page with the Firebug window. If you left click on the grade in the status bar, the Grade View will be displayed in the Firebug window. If you left click on the page weight value in the status bar, the Statistics View will be displayed in the Firebug window.
Chrome
Mobile/Bookmarklet
Refer to Mobile/Bookmarklet page for more information.
Opera
Safari
Refer to Safari page for more information.
Command Line (HAR)
Refer to Command Line HAR page for more information.
PhantomJS
Refer to PhantomJS page for more information.
NodeJS Server
Refer to NodeJS Server page for more information.
YSlow Views
</a> YSlow displays the results of its analysis in separate Grade, Components, and Statistics views. You can navigate between these views by selecting the tab with the view name under the YSlow tab of the Firebug console.
Following are descriptions of the Grade, Components, and Statistics views.
Grade View
</a> To view an analysis of the page’s performance, choose the Grade tab or click the page’s letter grade in the status bar at the bottom of the page.
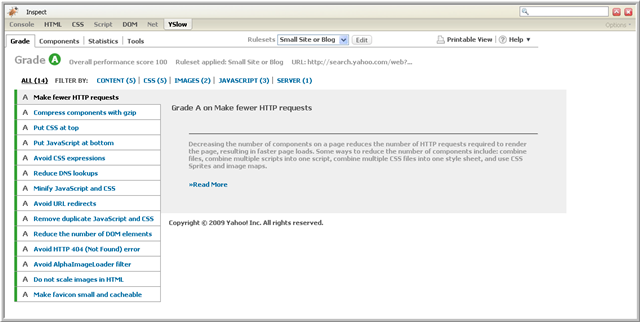
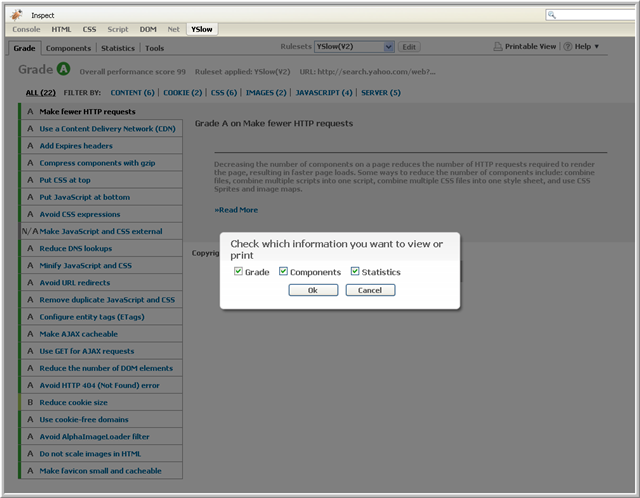
The Grade View displays a report card for the web page. The overall letter grade for the page is displayed at the top along with an overall numeric performance score. The page is graded based on 23 testable rules for high performance web pages (see Performance Rules). The rules are listed in order of importance from most important to least important. Each rule is assigned a letter grade A through F, with A being the highest grade.
Following is an example Grade View:
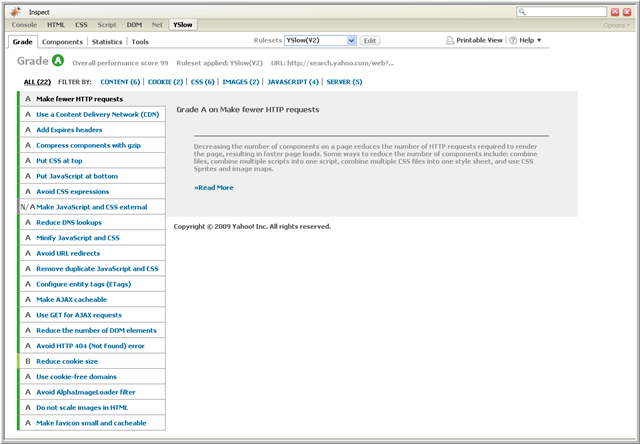
If a rule is not relevant to the web page, the grade returned is N/A, not applicable.
You can review your web page’s grades for each of the 23 testable rules. For each rule, a grade is listed along with a list of components that violated the rule and suggestions for improvement. Additionally, there is a short description of the rule and a Read More link you can click on to read more about how the rule impacts web page performance.
Components View
</a> To display information about the page’s components, choose the Components tab. The Components View displays all the components present on the web page. You might look at this view, for example, to see which components could be gzipped to improve performance.
Following is an example Components View:
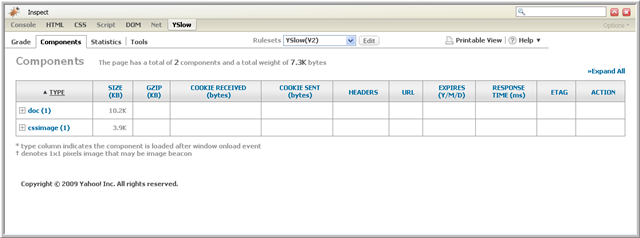
At the top of the display for this view there is a summary of the total number of components on the page and the page weight in kilobytes. Then there is a table with the component information. Click on the Expand All link to expand all the rows in the table.
Following is a summary of the columns in the Components View table:
- Type - the component’s type. The page is comprised of components of the following types: doc, js, css, flash, cssimage, image, redirect, favicon, xhr, and iframe.
- Size - the component’s size in kilobytes.
- Gzip - the component’s gzipped size in kilobytes.
- Cookie Received - the number of bytes in the HTTP Set-Cookie response header.
- Cookie Sent - the number of bytes in the HTTP Cookie request header.
- Headers - the HTTP header icon. To view the header click the
 icon. Click the icon again to close the header.
 - URL - the component’s URL.
- Expires - the date in the Expires header or
max-agein thecache-controlheader. This field is set to no expires if there is no expires information. - Response Time - the time in milliseconds it takes to load the component using
XMLHttpRequest. - ETag - the ETag response header value, if applicable.
- Action - an action to take on the component for additional performance analysis.
Statistics View
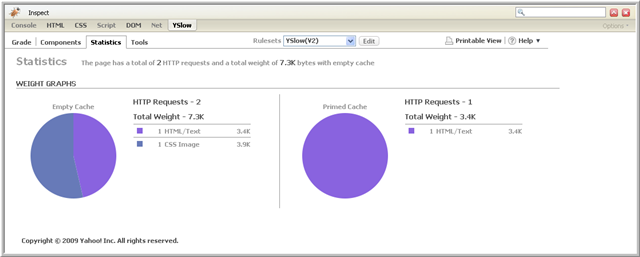
</a> To view statistics about the web page, choose the Statistics tab. This view provides a summary of the total number of HTTP requests and the total weight of the page in kilobytes as well as page weight analysis for both Empty Cache and Primed Cache perspectives. The Empty Cache perspective indicates all the components that the browser must request to load the page when the user visits it for the first time. In the Primed Cache perspective, all or most of the components would already be in the cache, which would reduce the number of HTTP requests and the weight of the page.
The Expires and Last-Modified headers of each component affect the Empty and Primed Cache perspectives. For example, when the cache is full, a component with an Expires header in the far future does not require an HTTP request and adds no weight to the page size. If a component is expired, but has a fairly old Last-Modified date, then it generates a conditional GET HTTP request. However, this usually results in a 304 Not Modified response and does not add any weight to the page.
Following is an example Statistics View:
YSlow Menu Bar
</a> The YSlow menu bar contains the Grade, Components, and Statistics tabs, which are described above. It also contains the Tools tab; for information about the Tools tab, refer to YSlow Tools. In addition to these four tabs, the menu bar also contains contains options for selecting and editing rulesets, creating a printable view of the page performance analysis, and getting help. These options are described in the following sections.
Rulesets
</a> Beginning with YSlow 2.0, you can select one of three predefined rulesets to use for your web page analysis or define your own custom ruleset. The three predefined rulesets are:
- YSlow(V2) - this ruleset contains all 23 testable rules.
- Classic(V1) - this ruleset contains the original 13 rules that were used in YSlow 1.0.
- Small Site or Blog - this ruleset contains the 14 rules that are applicable to small web sites or blogs. Refer to the image below to see which rules are in this ruleset.
Note that the ruleset last selected becomes the default ruleset. The default ruleset can be one of three predefined ones or one you create yourself.
To create your own ruleset, click on the Edit button next to the Rulesets pull-down menu. The New Ruleset screen shown below will be displayed:
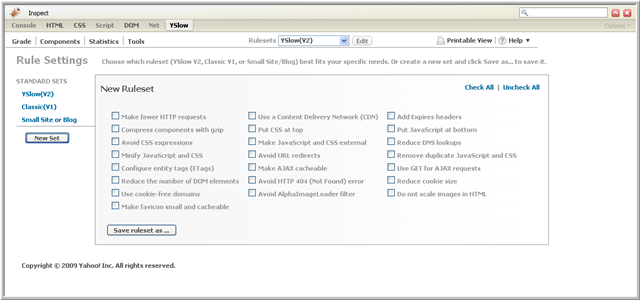
Initially all the rules will be unchecked. Select the rules you wish to include in your ruleset. Then click the Save ruleset as… button, enter a name for the ruleset, and click Save.
To run YSlow using your customized ruleset, select the ruleset from the Rulesets pull-down menu. YSlow will ask Do you want to run the selected ruleset now? Click on Run Test to run YSlow with your ruleset.
You can make additional edits to your ruleset by selecting your ruleset in the Rulesets pull-down-menu and clicking on Edit. You can remove rules previously selected and add new rules. When you complete your changes, either click Save to save the revised ruleset with the same name or click Save ruleset as… to create a new ruleset.
The following image shows the ruleset editing screen:
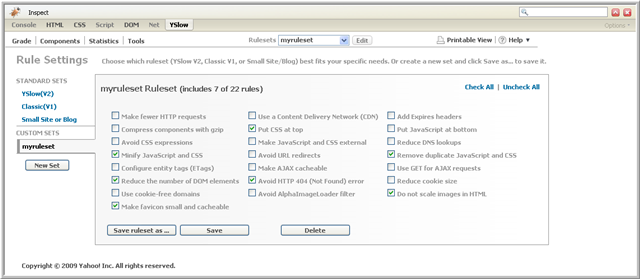
If you no longer need the ruleset, you can delete it by clicking on the Delete button.
Printable View
</a> Click on the Printable View link on the YSlow toolbar to display the page performance analysis. YSlow asks what information you want to display. Select one or more of the available views as shown in the following image:
YSlow will open a new window, formatted for printing, containing the information from the views you selected.
Help
</a> Click on Help to bring up the following menu:
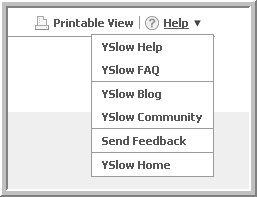
Following is a description of each of the help menu options:
- YSlow Help - links to this document, the YSlow User Guide
- YSlow FAQ - links to frequently asked questions about using YSlow
- YSlow Community - links to the Exceptional Performance Yahoo! group
- Send Feedback - links to a feedback form for sending comments and suggestions
- YSlow Home - links to YSlow home page
YSlow Tools
</a> YSlow’s Tools menu provides several reporting tools that you can use to get information to help with your web page analysis. Following is a screen shot of the Tools menu:
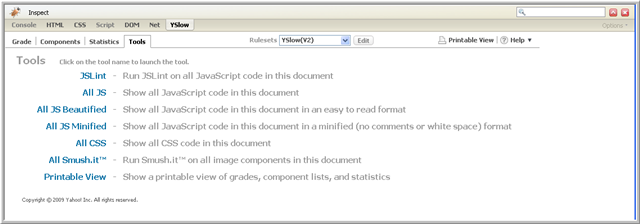
Each tool is described below.
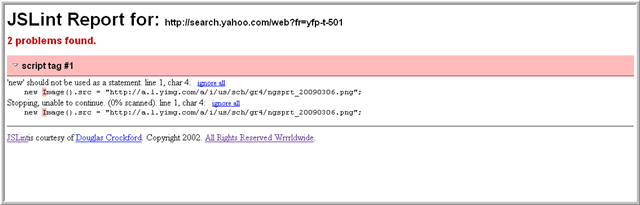
JSLint
</a> JSLint gathers all external and inline JavaScript from the current web page, submits it to JSLint, a JavaScript verifier, and opens a separate window with a report about problems with the page’s JavaScript. The report includes approximate locations within the source of the problem code. Often times the problems are syntax errors, but JSLint looks for style convention problems and structural problems too.
Following is an example JSLINT report:
All JS
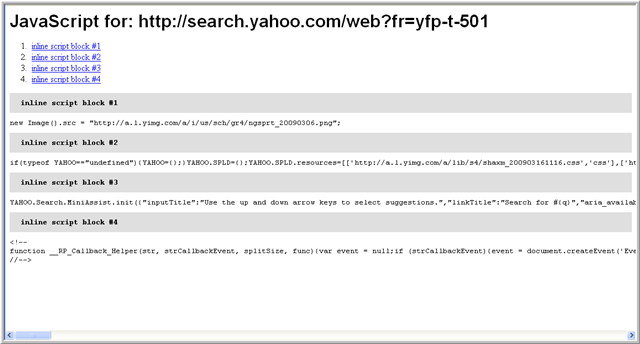
</a> All JS collects all external and inline JavaScript from the page and displays the scripts in a separate window. You might want to use this tool to check which scripts the page actually uses and whether the page is pulling them in correctly.
Following is an example All JS report:
All JS Beautified
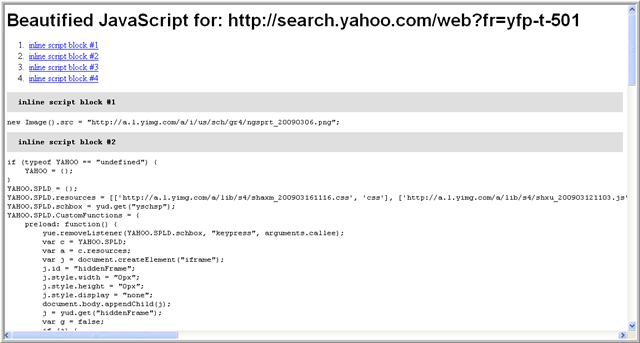
</a> All JS Beautified is similar to All JS except the JavaScript output is formatted to be more human readable.
Following is an example All JS Beautified report:
All JS Minified
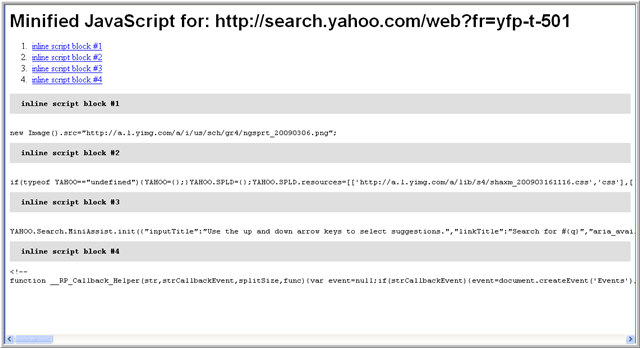
</a> All JS Minified collects all external and inline JavaScript and removes comments and white space to decrease the size of the scripts. You can replace your JavaScript with the minified version to improve performance of the web page.
Following is an example All JS Minified report:
All CSS
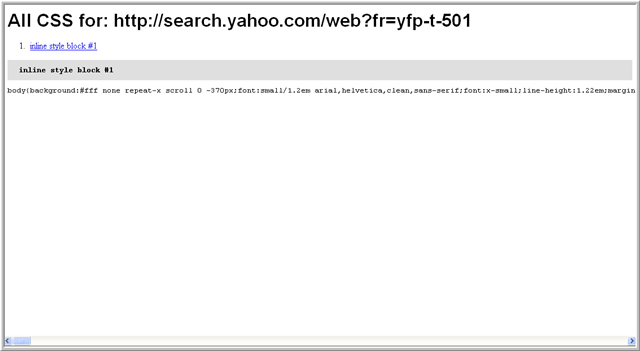
</a> All CSS collects all the inline and external stylesheets on the page and displays them in a separate window.
Following is an example All CSS report:
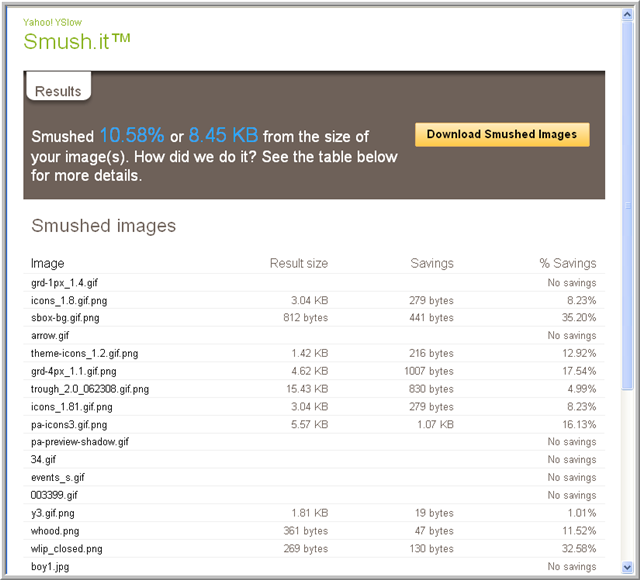
All Smush.it
</a> If you click on All Smush.it, Smush.it will be run on all the image components on the page. This tool will tell you which images can be optimized and will create a zip file with the optimized images. When you select this tool you will see output like the following:
Printable View
</a> Click on Printable View to open a new window with a printable view of grades, components, and statistics for the page.
YSlow Beacon
</a> YSlow can be configured to beacon back YSlow results to a server.
Here are the preferences that control the beacon:
extensions.yslow.optinBeacon - turn on or off sending yslow beacon
extensions.yslow.beaconUrl - specify url of the beacon
YSlow 1.x - YSlow 2.0.0b6
</a>
YSlow results are sent as cgi parameters appended to the url specified in extensions.yslow.beaconUrl via HTTP GET method.
YSlow beacon parameters
| Name | Value |
|---|---|
| w | total page size |
| o | overall score |
| u | url |
| r | total number of requests |
| s | space id of the page |
| i | id of the ruleset used |
| ynumreq | score for Make fewer HTTP Requests |
| ycdn | score for Use a Content Delivery Network(CDN) |
| yemptysrc | score for Avoid empty src or href |
| yexpires | score for Add Expires headers |
| ycompress | score for Compress components with gzip |
| ycsstop | score for Put CSS at top |
| yjsbottom | score for Put JavaScript at bottom |
| yexpressions | score for Avoid CSS expressions |
| yexternal | score for Make JavaScript and CSS external |
| ydns | score for Reduce DNS lookups |
| yminify | score for Minify JavaScript and CSS |
| yredirects | score for Avoid URL redirects |
| ydupes | score for Remove duplicate JavasScript and CSS |
| yetags | score for Configure entity tags (ETags) |
| yxhr | score for Make AJAX cacheable |
| yxhrmethod | score for Use GET for AJAX requests |
| ymindom | score for Reduce the number of DOM elements |
| yno404 | score for Avoid HTTP 404 (Not Found) error |
| ymincookie | score for Reduce cookie size |
| ycookiefree | score for Use cookie-free domains |
| ynofilter | score for Avoid AlphaImageLoader filter |
| yimgnoscale | score for Do not scale images in HTML |
| yfavicon | score for Make favicon small and cacheable |
YSlow 2.0.0 GA and up
</a>
Starting YSlow 2.0.0 GA, users can customize the YSlow results being included in YSlow beacon.
A new preference is introduced extensions.yslow.beaconInfo to indicate what to include in YSlow beacon. The value of this preference can be basic, grade, stats, comps, all or a comma separated list of grade, stats and comps.
Default value of the preference is basic. YSlow beacon is sent with HTTP GET if beaconInfo is set to basic; for all other values, the beacon is sent with HTTP POST method and the parameters are in JSON format as body of the POST request.
| Name | Value | Type |
|---|---|---|
| w | total page size | basic |
| o | overall score | basic |
| u | url | basic |
| r | total number of requests | basic |
| s | space id of the page | basic |
| i | id of the ruleset used | basic |
| lt | page load time | basic |
| g | scores of all rules in the ruleset. e.g.:
{
    "ynumreq": {
        "score": 85
    }
    "ydns": {
        "score": 85,
        "components": ["www.yahoo.com",
                       "l.yimg.com",
                       "us.i1.yimg.com",
                       "m.doubleclick.net",
                       "ad.doubleclick.net",
                       "srd.yahoo.com",
                       "us.bc.yahoo.com"]
},
...
} | grade |
| w_c | page weight with primed cache | stats |
| r_c | number of requests with primed cache | stats |
| stats | number of requests and weight grouped by component type. e.g.:
{
    "doc": {
        "r": 1,
        "w": 36858
    },
    "js": {
        "r": 3,
        "w": 29060
    },
    ...
}
| stats |
| stats_c | number of request and weight of components group by component type with primed cache | stats |
| comps | an array of all the components found on the page. e.g.:
[{
        "type": "doc",
        "url": "http://www.yahoo.com/",
        "size": 141710,
        "resp": 254,
        "gzip": 36858,
        "cr": 488,
        "cs": 396
},
{
        "type": "js",
        "url": "http://d.yimg.com/foo.js",
        "size": 978,
        "resp": 37,
        "gzip": "553",
        "expires": "2019/7/24"
},
        ...
] | comps |